MLA-C01 Metrics, Explainability, Bias and Experiment Comparison Guide
Study MLA-C01 Metrics, Explainability, Bias and Experiment Comparison: key concepts, common traps, and exam decision cues.
This lesson is about deciding whether a trained model is actually good enough to trust. MLA-C01 expects ML engineers to know which metrics fit which problems, how to compare variants fairly, and how explainability or debugging tools expose problems that raw accuracy can hide.
Shadow variant: Non-primary model or endpoint variant evaluated against production-like traffic or outputs without immediately becoming the full live path.
Convergence issue: Training behavior where the model fails to settle into a stable useful solution.
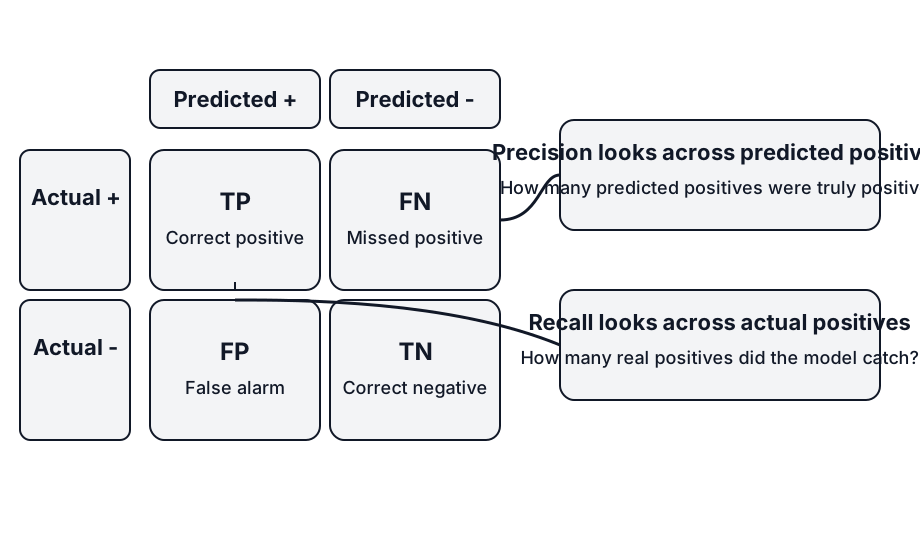
Confusion matrix: Grid that counts true positives, false positives, false negatives, and true negatives so classification metrics can be interpreted correctly.
What AWS is really testing here
AWS wants you to separate:
- metric choice from model choice
- explainability from raw performance numbers
- bias analysis from ordinary accuracy reporting
- controlled variant comparison from blind replacement in production
Why accuracy is not enough
MLA-C01 often rewards the candidate who reads the business failure mode first. A fraud model, disease screener, and recommendation model do not all optimize the same thing. Accuracy can look good even when one error type is operationally unacceptable.
| If the business fear is mainly… | Watch most closely | Why |
|---|---|---|
| missing rare but costly positive cases | Recall | False negatives are expensive |
| flooding operators or customers with bad alerts | Precision | False positives are expensive |
| class imbalance hiding bad behavior | Precision, recall, and F_1 |
Accuracy can flatter a weak model |
| rollout safety against a current model | Variant comparison metrics plus error slices | Aggregate accuracy alone can hide regressions |
Core metric formulas
For binary classification, the highest-yield formulas are:
\[ \text{Precision} = \frac{TP}{TP + FP}, \qquad \text{Recall} = \frac{TP}{TP + FN}, \qquad F_1 = 2 \times \frac{\text{Precision} \times \text{Recall}}{\text{Precision} + \text{Recall}} \]
Where:
TP= true positivesFP= false positivesFN= false negatives
The exam is rarely testing algebra for its own sake. It is testing whether you know which denominator changed when a model starts creating the wrong kind of mistake.
The diagram below is the fastest way to remember how the confusion matrix drives precision and recall.
Metric chooser
| Metric or tool | Strongest first when… | Common trap |
|---|---|---|
| Accuracy | classes are balanced and both error types cost roughly the same | treating it as the only metric under class imbalance |
| Precision | false positives are the main business cost | using it alone when missed positives are catastrophic |
| Recall | false negatives are the main business cost | chasing recall so hard that alert quality collapses |
F_1 |
you need one blended view of precision and recall | using it when business costs are clearly asymmetric |
| Explainability tools | you need to understand why a model made a prediction | confusing explanation with proof of fairness |
| Bias-analysis tooling | you need subgroup fairness or skew review | assuming global accuracy already proved fairness |
| Shadow variant | you want production-like comparison before full rollout | assuming a shadow result automatically justifies promotion |
Explainability, bias, and experiment comparison are different lanes
These concepts are adjacent, but they are not interchangeable:
| Lane | Main question |
|---|---|
| Explainability | Why did this model produce this output? |
| Bias analysis | Are outcomes systematically different across important groups? |
| Convergence debugging | Did training stabilize into a useful solution at all? |
| Experiment comparison | Which model performs better under the chosen success criteria? |
If the stem asks why an individual prediction happened, you are in the explainability lane. If it asks whether one group is disadvantaged, you are in the bias lane. If it asks whether a proposed replacement is safer than the current model, you are in the experiment-comparison lane.
Harder scenario question
A medical-screening model reports 98% accuracy, but the positive class is rare and missed positives are costly. A second model has slightly lower accuracy, much better recall, and only a modest drop in precision. Which framing is strongest first?
- A. Keep the first model because the highest accuracy always wins
- B. Prefer the second model because recall matters more when false negatives are costly
- C. Ignore both and compare only training loss
- D. Replace both models with a larger instance size
Correct answer: B. The operational requirement is about missed positives, so recall deserves priority. The exam often hides that business cost behind a superficially stronger accuracy number.
Decision order that usually wins
- Decide whether the question is mainly about metric tradeoffs, model explainability, bias detection, or safe live comparison.
- If the issue is understanding why the model made a prediction, stay in the explainability lane.
- If the issue is unfair or uneven behavior, move to bias analysis before deployment arguments.
- If the issue is comparing live behavior before a full cutover, think shadow or controlled-traffic evaluation.
- Read precision, recall, and similar metrics operationally: what kind of mistake is becoming too common?